Performing an accurate solar savings estimation requires more than just checking your monthly power bill against a generic online calculator. In my years of evaluating renewable energy installations, I have seen too many homeowners surprised by longer payback periods because they ignored the nuanced technical realities of their specific property. To provide you with a reliable framework, I selected these five factors based on their direct impact on annual energy yields, their complexity in financial modeling, and their ability to influence your long term return on investment. We will look at how geographic location, structural characteristics, and local policy intersect to determine if a rooftop array is a sound financial move. By understanding these variables, you can move past marketing hype and build a data driven projection that accounts for both the physics of light and the economics of the modern power grid.
1. Solar irradiance and peak sun hours
Solar irradiance measures the amount of power received from the sun per unit area, while peak sun hours represent the equivalent number of hours per day when solar intensity averages 1,000 watts per square meter. This factor determines the raw fuel available to your panels and varies significantly based on your latitude and local weather patterns. According to the National Renewable Energy Laboratory (2022), modern solar panels convert roughly 20 percent of this incoming energy into usable electricity, making the baseline solar resource the most critical starting point for any calculation.
To use this factor, you should access the PVWatts calculator which is a tool developed by the federal government to model energy production. Input your specific address to see the monthly distribution of sun hours and account for seasonal dips during winter months. You must ensure you are looking at the direct normal irradiance for your specific zip code rather than a broad state average to get a precise result. This data allows you to size your system correctly so you do not pay for more panels than your local sunlight can actually support.
In practice, many people confuse daylight hours with peak sun hours. A location might have 14 hours of daylight in the summer, but it may only provide 5.5 peak sun hours for actual energy production. What most guides miss is that cloud cover and humidity in certain regions can reduce your total annual yield by as much as 20 percent compared to desert climates with identical latitudes.
Best for: Establishing the maximum possible energy production ceiling for your specific geographic location.
Key takeaway: Your savings are capped by the physical amount of sunlight your region receives regardless of the panel brand you choose.
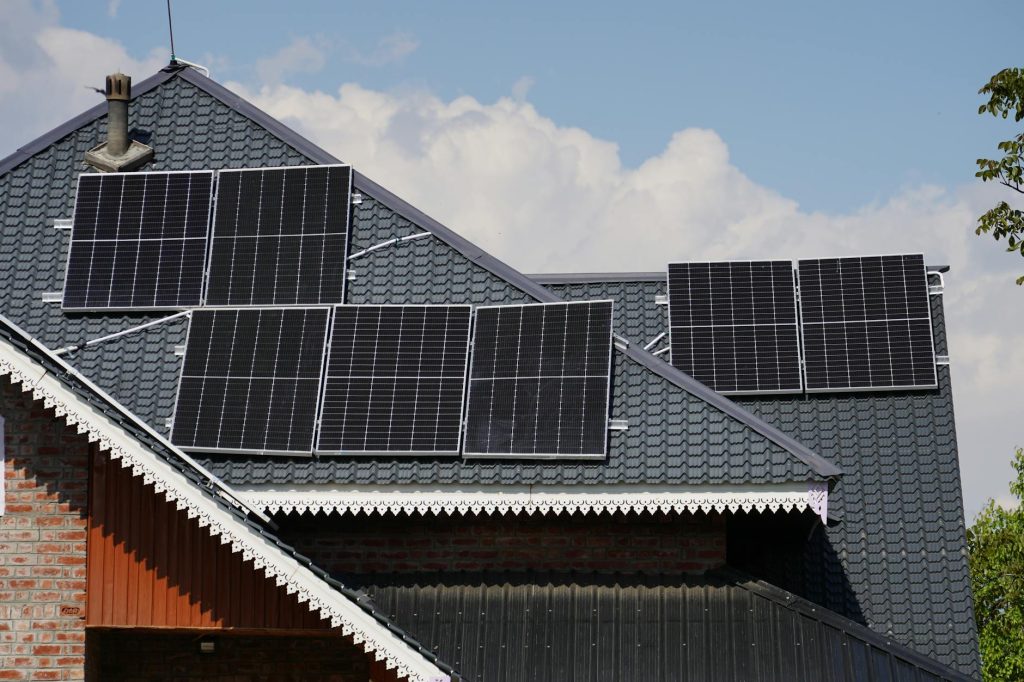
2. Roof orientation and tilt angle
The orientation of your roof, known as the azimuth, and its pitch, or tilt angle, dictate how effectively your panels capture the available peak sun hours. In the northern hemisphere, a south facing roof generally produces the most energy over a full year because it tracks the sun as it moves across the southern sky. However, the tilt of your roof should ideally match your latitude to maximize production during the peak of the day when the sun is highest. If your roof faces east or west, you might see a production drop of 15 to 20 percent which directly extends your financial payback period.
To evaluate this, you can use a simple smartphone app like SunSeeker or a physical clinometer to measure the exact degree of your roof slope. If you have a flat roof, you have the advantage of using tilted racking systems to hit the optimal angle, though this adds to the initial hardware cost. Compare these measurements against your local latitude to see how far you deviate from the ideal 30 to 45 degree tilt common in many residential areas. Understanding this geometry helps you decide if you need higher efficiency panels to compensate for a sub optimal roof direction.
From experience, I have found that west facing roofs can sometimes be more profitable than south facing ones if your utility uses time of use pricing. Because electricity is often most expensive in the late afternoon when people return home and turn on appliances, a west facing array that catches the setting sun can offset higher costs better than a south facing one. This is a non obvious gotcha that can flip the script on your total savings calculation.
Best for: Determining the efficiency of your specific roof surfaces for mounting photovoltaic hardware.
Key takeaway: Proper alignment can be the difference between a system that pays for itself in seven years versus one that takes twelve.
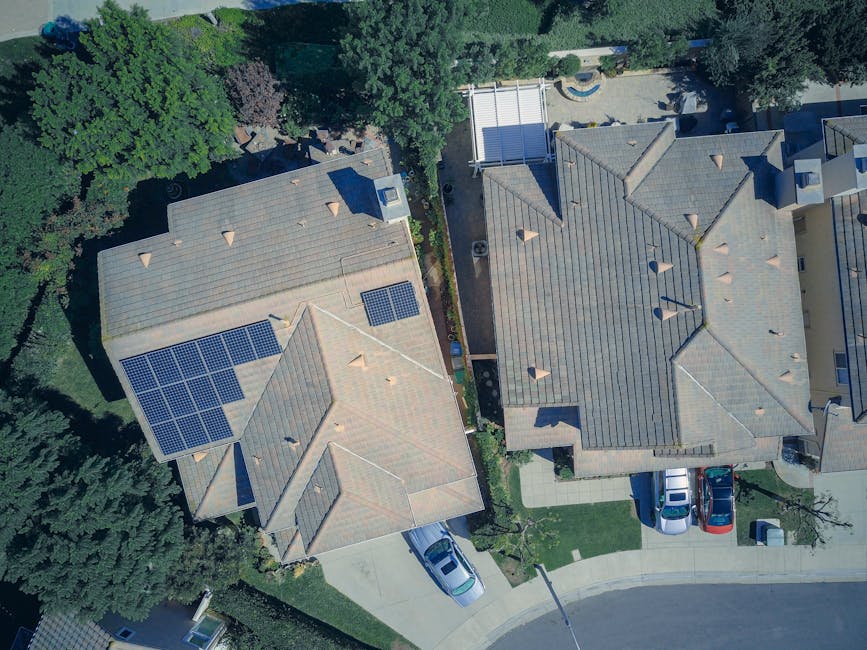
3. Local shading and obstruction analysis
Shading is the single most common reason why a solar savings estimation fails to match real world performance once the system is live. Even a small amount of shade from a chimney, a vent pipe, or a neighboring tree can disproportionately reduce the output of an entire string of panels. This happens because most traditional inverters treat a series of panels like a garden hose, so if one section is pinched by shade, the flow for the entire line is restricted. Furthermore, shading impacts change throughout the year as the sun sits lower in the sky during the winter, casting longer shadows across your roof.
You can use a tool like Google Project Sunroof to get a high level view of your roof shading based on 3D modeling and satellite data. For a more professional approach, many installers use a Solar Pathfinder or digital LIDAR maps to create a year round shading report. You should identify any trees that will grow significantly over the next decade as these will become future obstructions that could ruin your ROI. If you have significant shading, you should look into power optimizers or microinverters which allow each panel to operate independently and mitigate the impact of localized dark spots.
A common mistake here is ignoring “soiling loss” which is related to shading but caused by accumulated dust, pollen, or bird droppings. In dry climates, this can act like a semi transparent shade layer that reduces output by 5 percent or more. I have seen systems in agricultural zones lose nearly 15 percent of their efficiency during harvest season because of dust, which is a factor most generic calculators never mention.
Best for: Identifying physical barriers that could significantly degrade your system performance over time.
Key takeaway: Microinverters can save your project if you have unavoidable shading, but removing obstructions is always the cheaper path.
4. Utility rate structures and net metering
The financial value of the electricity you produce is determined entirely by your utility company and the specific rate plan you are on. Net metering is a billing mechanism that credits solar energy system owners for the electricity they add to the grid. If your utility offers 1:1 net metering, every kilowatt hour you export is worth exactly what you pay for a kilowatt hour you import. According to the Solar Energy Industries Association (2023), the average residential solar system cost has dropped 40 percent over the last decade, yet the move by utilities away from favorable net metering can make solar less attractive despite lower hardware prices.
You should review your most recent utility bill to identify if you are on a flat rate or a time of use plan. Contact your provider to ask about their current net metering policy, specifically if they are moving toward “NEM 3.0” or similar structures that reduce the value of exported power. If your utility pays very little for exported energy, you may need to include a battery storage system like the Tesla Powerwall in your estimation. This allows you to store your own power for use at night rather than selling it back to the grid at a loss.
In addition, you must account for fixed monthly charges that do not go away even if you produce 100 percent of your energy. Most utilities charge a connection fee of $15 to $30 just to stay on the grid. I have seen homeowners get frustrated because they produced more than they used but still had a bill to pay, so you must factor these non bypassable charges into your final savings math.
Best for: Calculating the actual dollar value of every kilowatt hour your roof generates.
Key takeaway: Solar is a hedge against rising utility rates, but your local utility rules dictate the speed of your payback.
5. Federal and local financial incentives
Government incentives can slash the net cost of a solar installation by more than a third, making them a pillar of any solar savings estimation. The most significant of these is the Federal Investment Tax Credit (ITC), which currently allows you to deduct 30 percent of the total cost of your solar system from your federal taxes. In addition to the federal credit, many states and municipalities offer their own rebates, performance based incentives, or sales tax exemptions. These programs are often designed to accelerate the adoption of green tech by reducing the upfront capital requirements for homeowners.
To find these, search the Database of State Incentives for Renewables and Efficiency (DSIRE) which is the most comprehensive source for local policy. You need to verify if the incentives are tax credits, which require you to have a tax liability to use them, or direct rebates, which are paid regardless of your tax situation. Furthermore, check if your local utility offers Solar Renewable Energy Credits (SRECs). In some markets, you can sell these credits to utilities for hundreds of dollars a year, providing an ongoing revenue stream that shortens your break even point.
The part that actually matters is the timing of these incentives. Tax credits do not reduce the check you write to the installer today, so you still need the full amount or a loan upfront. What most guides miss is that if you finance your system, your monthly loan payment might be higher than your old power bill until you receive your tax refund and apply it to the principal of the loan. This temporary cash flow dip is a critical part of your home automation and energy planning.
Best for: Reducing the total capital expenditure and improving the overall internal rate of return.
Key takeaway: The 30 percent federal credit is the most powerful tool for solar affordability, but it requires proactive tax planning.
Final verdict on solar factors
After weighing these five factors, the most critical element for your estimation is Factor 4: Utility rate structures and net metering. While sun hours and roof tilt determine how much power you make, the utility policy determines how much that power is actually worth to your bank account. You can have the most efficient panels on a perfectly oriented roof, but if your utility only pays you pennies for exported power while charging you dollars for imported power, the project will never reach a high ROI. Consequently, I recommend prioritizing a deep dive into your local utility contract before you even speak to a contractor. In my experience, a well informed homeowner who understands their rate plan can often out negotiate a salesperson who is using generic regional averages. Start with your bill, then move to the physical roof characteristics to build a bulletproof financial model for your solar future.
Cover image by: Kindel Media / Pexels